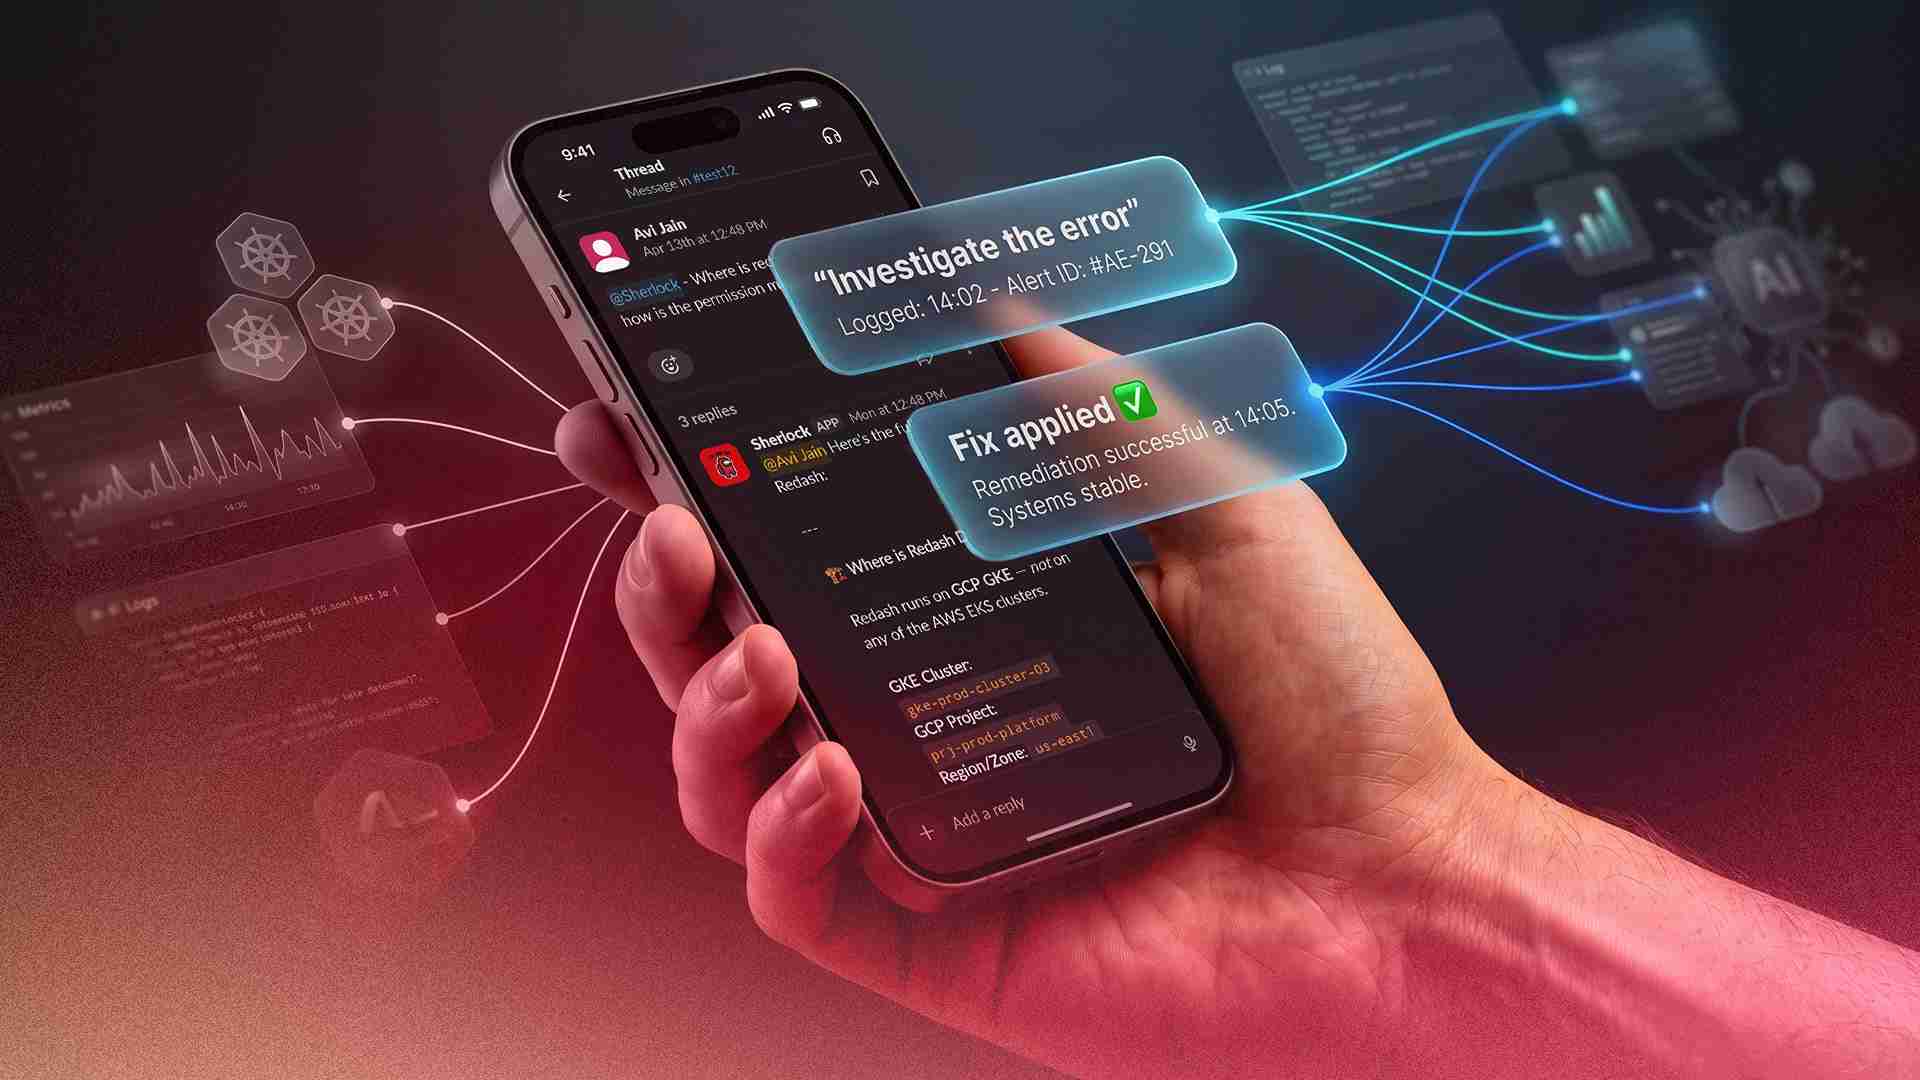
At 5:30 PM on a Monday, a PagerDuty alert fired: OpenSearch storage on our primary logging cluster had dropped to 11 GB free — on a multi-terabyte cluster running at 97% capacity across all data nodes. The on-call engineer acknowledged the alert, tagged Sherlock in the Slack thread, and typed five words: "Investigate this. Also let me know the fix."
Within two minutes, Sherlock had queried every data node's disk usage, enumerated all 2,001 indices by size, identified that 321 logstash indices dating back 15 months had never been cleaned up, found 1.5 TB of static data sitting on hot storage instead of warm nodes, and delivered a ranked remediation plan — from immediate deletes that would reclaim 900 GB, to long-term ISM policy fixes. When a follow-up question asked whether the lifecycle policies were working, Sherlock ran a full audit and uploaded a detailed report as a file to the thread.
No context-switching. No SSH sessions. No runbook lookup. One Slack message, one investigation, one fix plan.
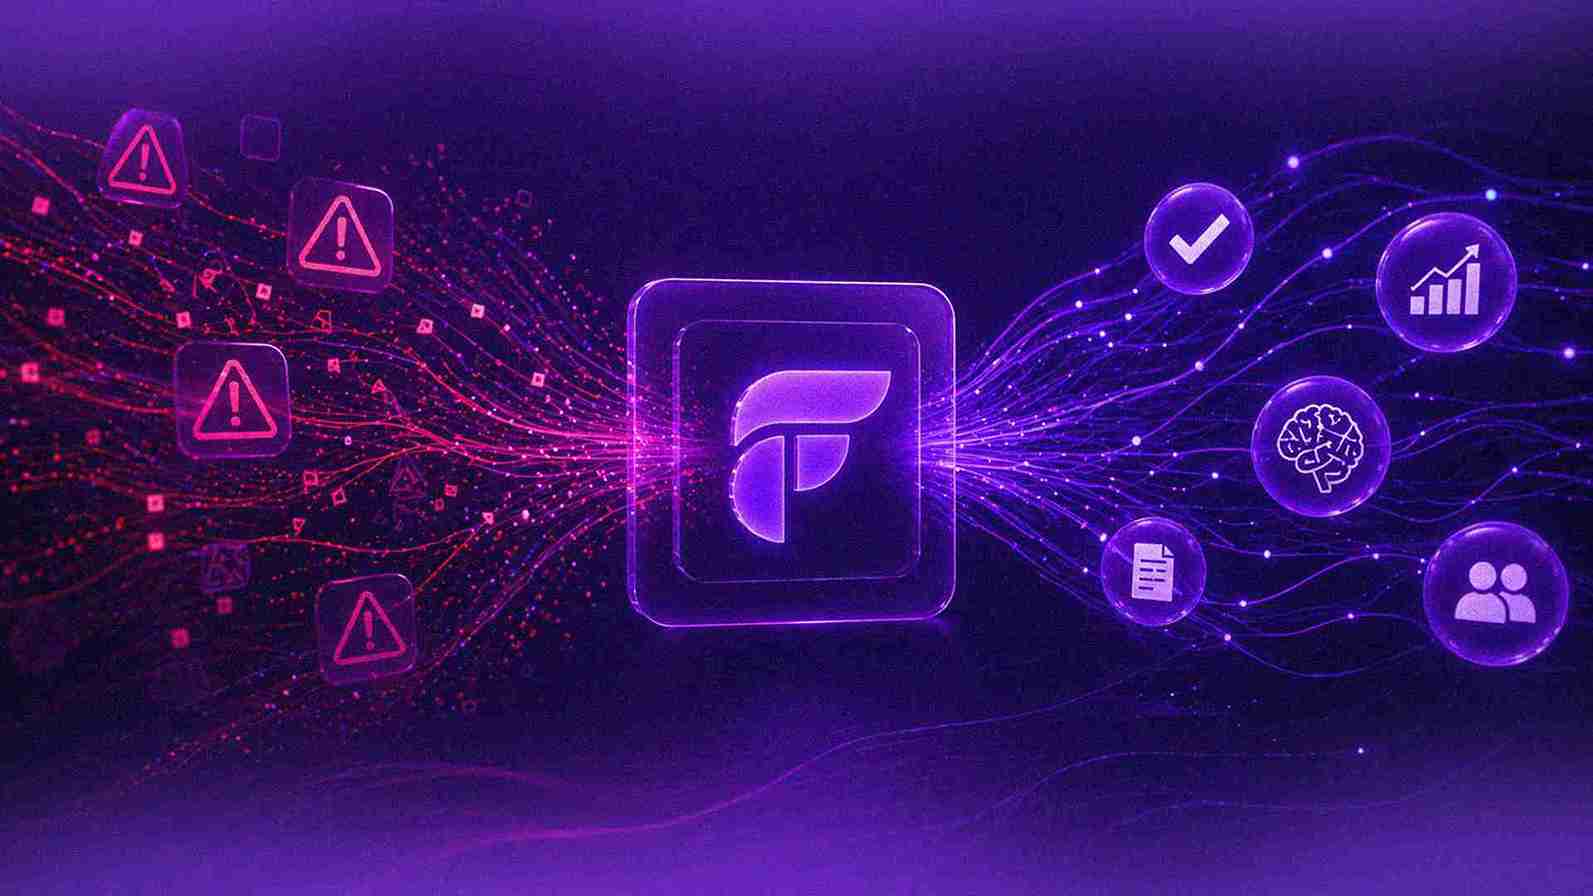
This is Sherlock — the AI SRE agent we built at Pocket FM. And the OpenSearch incident is one of 3,563 investigations it has run since going live — across 134 engineers, 146 Slack channels, and 88,349 tool executions.
The Problem: Debugging at Scale Doesn't Scale
Pocket FM runs a complex microservices architecture across multiple Amazon EKS clusters, serving millions of users across multiple geographies. Our observability stack spans Kubernetes, Prometheus, Grafana, Datadog, OpenSearch, multiple databases, and cloud-native services on AWS and GCP. A typical production investigation might require an engineer to check pod logs, query Prometheus metrics, search Datadog traces, inspect OpenSearch indices, review recent deployments in ArgoCD, and cross-reference with PagerDuty alerts — all before forming a hypothesis.
For a senior SRE, this takes 45–90 minutes. For a product engineer unfamiliar with the infrastructure, it might take half a day — or a Slack message to the SRE team asking for help.
We had a choice: keep scaling the SRE team linearly with the organization, or build something that could give every engineer SRE-level investigative capability without needing dedicated SRE bandwidth for every debug session.
We chose to build Sherlock.
How Sherlock Works: The Agentic Loop
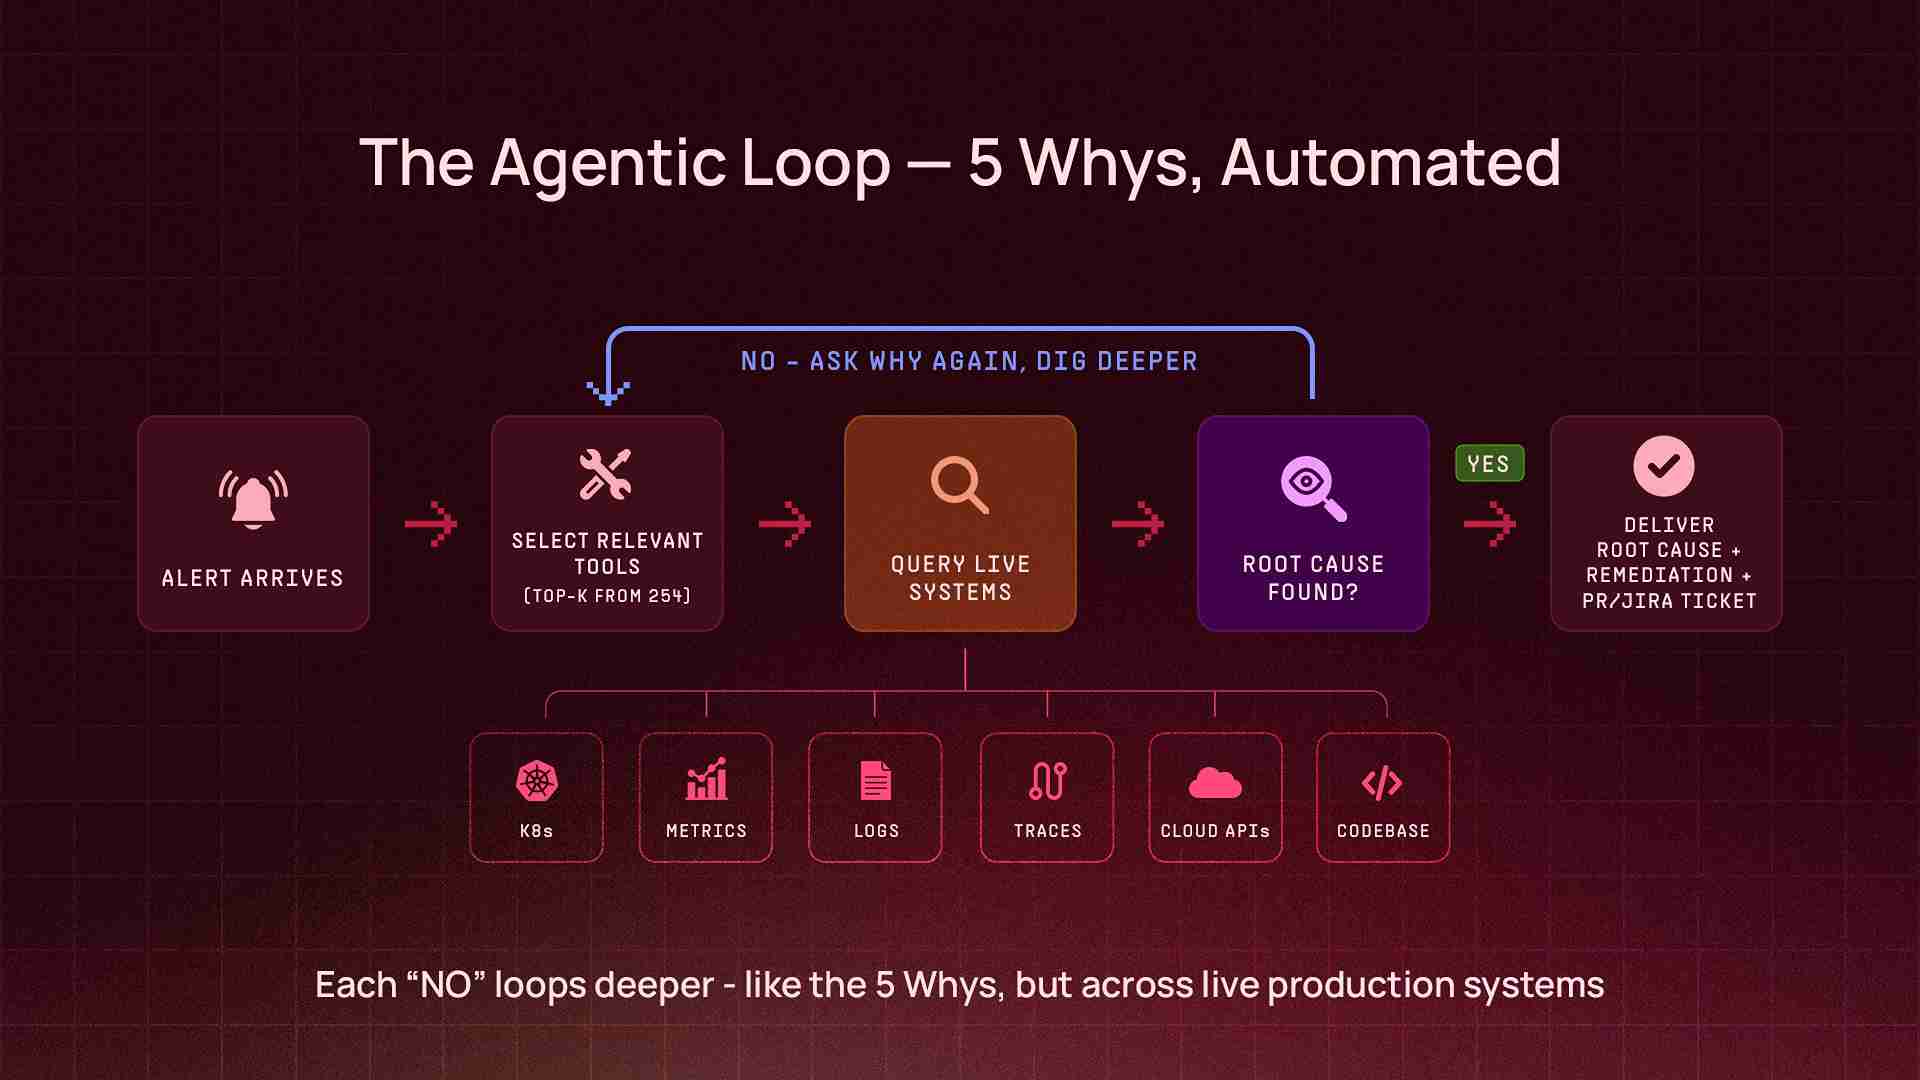
Sherlock is not a chatbot with a retrieval layer. It's an autonomous agent that runs an agentic loop — a cycle of reasoning, tool selection, execution, and iteration that continues until the agent has gathered enough evidence to deliver a conclusion. Think of it as the 5 Whys principle, automated: Sherlock doesn't stop at the first answer. It keeps asking why — querying deeper, correlating across systems, peeling back layers — until it reaches the actual root cause.
Alert or Question (via Slack / CLI)
        ↓
Sherlock selects relevant tools from 200+ available
        ↓
Queries live systems (Kubernetes, metrics, logs, traces, cloud APIs, codebases)
        ↓
Analyzes results, asks "why?" — decides if more data is needed
        ↓
Iterates — calls more tools, cross-references findings, digs deeper
        ↓
Delivers root cause analysis + remediation steps (or raises a PR to fix it)
The key architectural decision: Sherlock doesn't work with pre-indexed data or cached snapshots. Every investigation queries live production systems and codebases in real time. When it checks pod status, it's running against the actual cluster. When it queries metrics, it's hitting the real monitoring API. When it traces a bug, it reads the actual source code from the repository, walks the call chain, and identifies the exact function and line number responsible. This means the answer is always current — not stale by hours or days — and grounded in what the code actually does, not what documentation says it should do.
The Tool Layer
At the core of Sherlock's capabilities is a tool layer — a collection of over 200 integrations that the agent can invoke during an investigation. Each tool is a thin wrapper around an API endpoint or CLI command, designed to return structured data that the LLM can reason about.
The tools span the full observability, operations, and development stack:
Infrastructure & Observability - Kubernetes operations across all production clusters (pods, deployments, events, logs, resource metrics) - Prometheus metrics (PromQL queries, alert investigation) - Grafana dashboard inspection - Datadog logs, metrics, traces, and APM data - OpenSearch / Elasticsearch cluster health, index management, and log queries
Cloud Platforms - AWS services (RDS, CloudWatch, IAM, S3, ECR, and more) via a dedicated Model Context Protocol (MCP) server - GCP services (Cloud Logging, Monitoring, Storage) via MCP - Multi-account, multi-region support
Databases - PostgreSQL, MongoDB Atlas — health checks, slow query analysis, connection diagnostics
Codebase & Version Control - GitHub — repository search, source code reading, pull request creation, code changes, commit history, and CI/CD workflow inspection via MCP - Full codebase context: Sherlock can read source files, trace call chains, and understand application logic — not just infrastructure state
Workflow & Ticketing - Jira — create, search, update, and transition issues - PagerDuty — incident investigation and correlation - Confluence — knowledge base search and documentation
Synthetic Monitoring - Checkly — API and DNS check results, failure analysis, historical availability and response time trends - Cloud health checks — Route 53 health check status and DNS resolution monitoring
Operational Tools - ArgoCD application status and deployment history - Helm release inspection - Bash command execution (with safety validation) - Python code execution (for data analysis, report generation, file creation) - Slack file uploads (for delivering CSV reports, audit files directly in-thread)
Deferred Tool Loading
With 200+ tools available, loading every tool definition into the LLM's context window on every request would be wasteful — most investigations only need 10–15 tools. Sherlock uses deferred tool loading: on each request, it evaluates the user's question and loads only the top-K most relevant toolsets. This keeps the context window focused and reduces token costs without limiting capability.
Multi-Cluster Architecture
Pocket FM operates multiple EKS clusters spanning production, data engineering, and development workloads. Sherlock is deployed on the primary production cluster and can query any cluster through a unified multi-cluster tool layer. Engineers don't need to know which cluster a service runs on — Sherlock maps informal names ("the consumer cluster," "the worker cluster") to the correct Kubernetes context automatically.
What It Actually Looks Like in Production
Numbers are easy to quote. What matters is what the tool actually does when an engineer needs it at 2 AM. Here are three real investigations from Sherlock's first weeks — taken directly from production Slack threads.
Case 1: A New Service, Three Repositories, One Slack Message
Onboarding a new microservice into a Kubernetes-based infrastructure is one of those tasks that sounds simple until you actually do it. At Pocket FM, it means creating container registries, provisioning IAM roles and secrets in AWS, writing Kubernetes manifests with deployments, service accounts, autoscaling configs, and pod disruption budgets, wiring up an ArgoCD application to sync it all, and making sure every name, every ARN, and every cross-repo reference is consistent. Miss one, and the deployment fails silently. Get the merge order wrong, and Terraform errors cascade. A senior SRE can do this in a few hours. A product engineer trying it for the first time might spend a full day — and still need SRE review.
On April 17th, a platform engineer needed to onboard a new Temporal worker service for the GenAI team. He opened a Slack thread, tagged Sherlock, and typed one message:
"Can you help me create a new service following the rules defined here" — followed by a link to the onboarding spec, and four parameters: team name, environment, service name, and application type.
What happened next took seconds, not hours.
Sherlock read the onboarding specification, studied an existing production service as a reference pattern, and generated a complete 9-file Kustomize overlay — deployment manifest, service account with IRSA annotation, external secret store, external secret, KEDA scaled object for Temporal-based autoscaling, pod disruption budget, Prometheus pod monitor, environment config, and the kustomization file stitching it all together. It raised a PR, created a Jira ticket, and listed the prerequisites that still needed human action (secret values, Temporal namespace registration).
But a service onboarding doesn't live in one repo. Sherlock had flagged that two more repositories needed changes — the security repo for IAM and container registry provisioning, and the GitOps repo for the ArgoCD application. The engineer replied: "Raise all three PRs please."
Sherlock raised the remaining two PRs — in a single response:
Security repo — the Terraform configuration entry to provision the container registry, AWS Secrets Manager secret, and IAM role with IRSA trust policy
GitOps repo — the ArgoCD application manifest pointing to the new overlay
Three PRs total, across three separate repositories. Three Jira tickets. Correct merge order specified (security repo first → run Terraform → then the other two). Naming verified consistent across all three repos. The PRs were approved, and the team moved to populating secrets and deploying. One Slack message. Three repositories. Nine Kubernetes manifests. Three PRs. Three Jira tickets. A task that used to require a senior SRE's full afternoon — completed before the engineer finished their coffee.
Case 2: Sherlock Debugging Itself — the Log Pipeline Mystery
This one has a narrative twist: Sherlock's own logs stopped appearing in OpenSearch. An engineer asked Sherlock to figure out why.
Sherlock investigated its own Kubernetes deployment, examined the Fluent Bit log shipping pipeline, and found the root cause: a field type conflict in OpenSearch. The Slack bot's Helm template included both flat labels (like app: sherlock-slack-bot) and hierarchical Kubernetes labels (like app.kubernetes.io/name, app.kubernetes.io/instance). When Fluent Bit shipped these to OpenSearch, the kubernetes.labels.app field couldn't be both a text type (from the flat label) and an object type (from the dotted labels) — causing a mapping conflict that silently dropped the logs.
Within four minutes of the initial ask, Sherlock had:
Diagnosed the field type conflict across the Kubernetes → Fluent Bit → OpenSearch pipeline
Checked the ArgoCD deployment to find the correct Helm values file
Raised a PR removing the conflicting app.kubernetes.io/* labels from the Slack bot deployment template, while keeping the flat app label for identification
Created a Jira ticket tracking the fix
Warned about a side effect: since selector.matchLabels changed, ArgoCD would delete and recreate the deployment (not rolling update), causing a ~30-second Slack reconnection
Flagged a broader issue: the same label pattern existed in five other service templates, which would need the same fix
An AI agent that can debug its own infrastructure — and proactively identify where else the same bug exists — is a different kind of tool.
Case 3: Four Rounds Deep — the MongoDB Replica Set That Wouldn't Heal
An engineer noticed a MongoDB pod's readiness probe was failing and asked Sherlock for help. What followed was a four-round interactive debugging session where each human action revealed a new layer of the problem — and Sherlock adapted its analysis each time.
Round 1 — Initial diagnosis. Sherlock found that the MongoDB secondary pod had been failing its readiness probe for over 4 hours (1,734 consecutive failures). The cause: the pod was stuck in a NotYetInitialized state because the mongodb-replica-set-key secret was out of sync between what ArgoCD wanted to deploy and what was live in the cluster. Without matching keys, the secondary couldn't authenticate to join the replica set. Sherlock provided two fix options: sync the secret via ArgoCD, or pin the key in Helm values.
Round 2 — Still broken. The engineer checked back 90 minutes later: "Can you check, is it fixed?" Sherlock re-inspected: no — the readiness probe had now failed 2,305 times. The replica set was still not initialized. Sherlock provided escalated fix commands, including deleting the stuck pods to force reinitialization.
Round 3 — Deeper root cause revealed. The engineer deleted the pods as suggested, but the problem persisted. Sherlock ran a deeper investigation and found the situation had evolved: now there was no primary at all — mongodb-0 was stuck as RSOther, not PRIMARY. The reason: the arbiter pod was failing SCRAM authentication because it was initialized with the old replica set key, while the data nodes had the new one. Without the arbiter authenticating, there was no quorum for a primary election. Sherlock explained why simply deleting pods wouldn't fix this — the keyfile mismatch was baked into the persistent volumes — and provided a specific three-step fix: sync the secret, then delete the arbiter, then delete the primary, in that order.
Round 4 — Correcting the wrong fix. The engineer asked: "What if I add the replicaSetKey to AWS Secrets Manager?" Sherlock's response: "No — that will NOT help." It explained that the MongoDB replica set key was managed by the Bitnami Helm subchart, not by External Secrets. The AWS secret fed into a completely different Kubernetes secret for the application layer. Sherlock then provided two complete fix paths — a "nuclear reset" (fastest, wipes data) and a "data-preserving" approach (force-reconfig the replica set as standalone, then rebuild) — with exact commands for each. It also recommended a permanent fix: pinning the replicaSetKey in Helm values to prevent the Bitnami chart from auto-generating a new random key on every sync.
Four rounds. Each one peeled back another layer. Sherlock didn't just answer questions — it corrected assumptions, adapted to new state, and provided escalating fix strategies as the problem evolved.
The Numbers: 38 Days in Production
Since March 13, 2026 — Sherlock's first 38 days in production:
Metric | Value
|
Total investigations | 3,563 |
Success rate | 95.3% |
Engineers using Sherlock | 134 |
Slack channels with active usage | 146 |
Total tool calls executed | 88,349 |
Unique tools used | 254 |
Peak daily investigations | 240 |
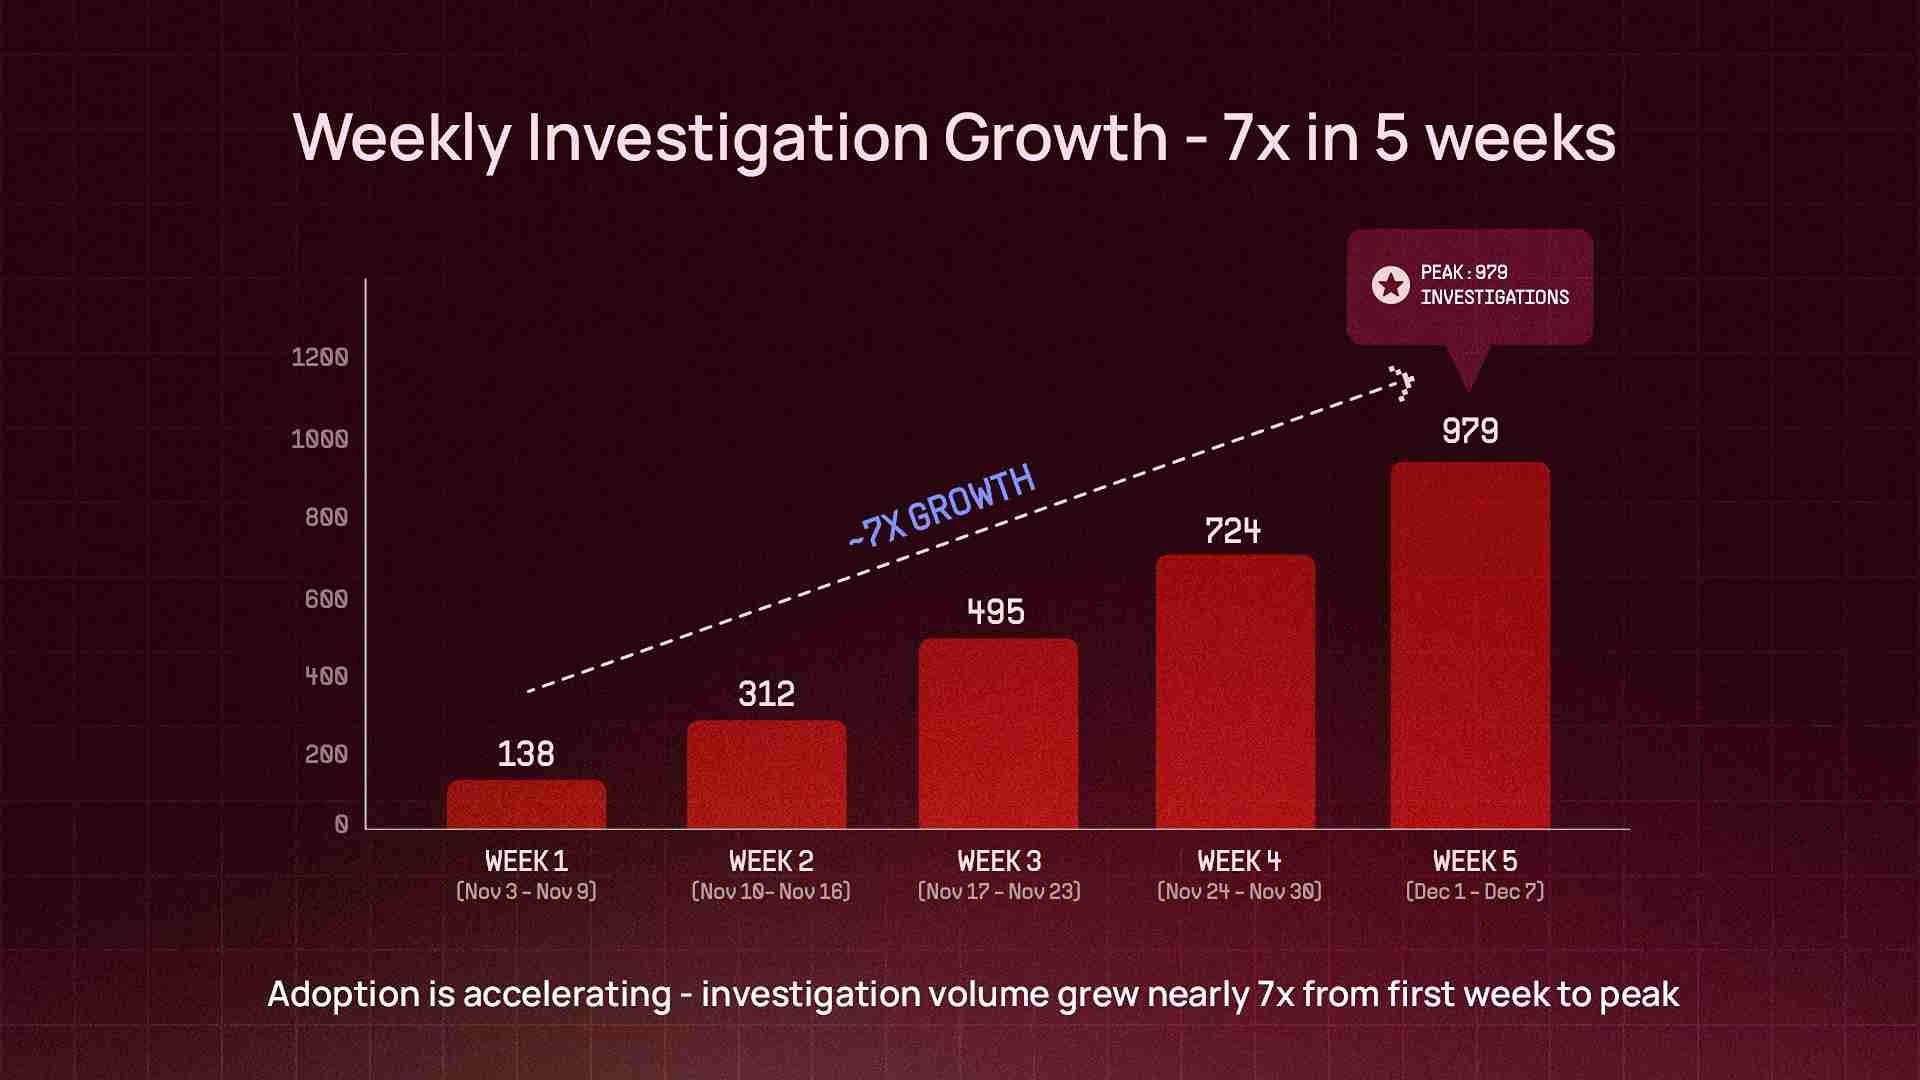
Week 1 → Week 5 growth | ~7x |
Investigation Depth
These aren't simple Q&A lookups. The median investigation completes in 2.7 minutes, but behind that number is real depth — the deepest single investigation hit 105 tool calls across 56 reasoning cycles: the equivalent of an engineer running over a hundred CLI commands, API queries, log searches, and code reviews across different systems — compressed into a single Slack thread.
Conservative estimate: 600+ engineering hours saved in 38 days. Tasks that previously took 45–90 minutes — cross-system debugging, alert investigation, deployment troubleshooting — now take 2–5 minutes (median response time: 2.7 minutes). That's approximately 7–8 full-time engineer equivalents of capacity unlocked per month.
Sherlock is not an SRE-only tool. It's used across 9 engineering teams — from platform and payments to content, ads, analytics, and information security. The InfoSec team in particular has adopted it for incident response, cost optimization, security audits, IAM management, and CI/CD workflow audits — use cases we didn't originally design for but that emerged organically from the tool layer's breadth.
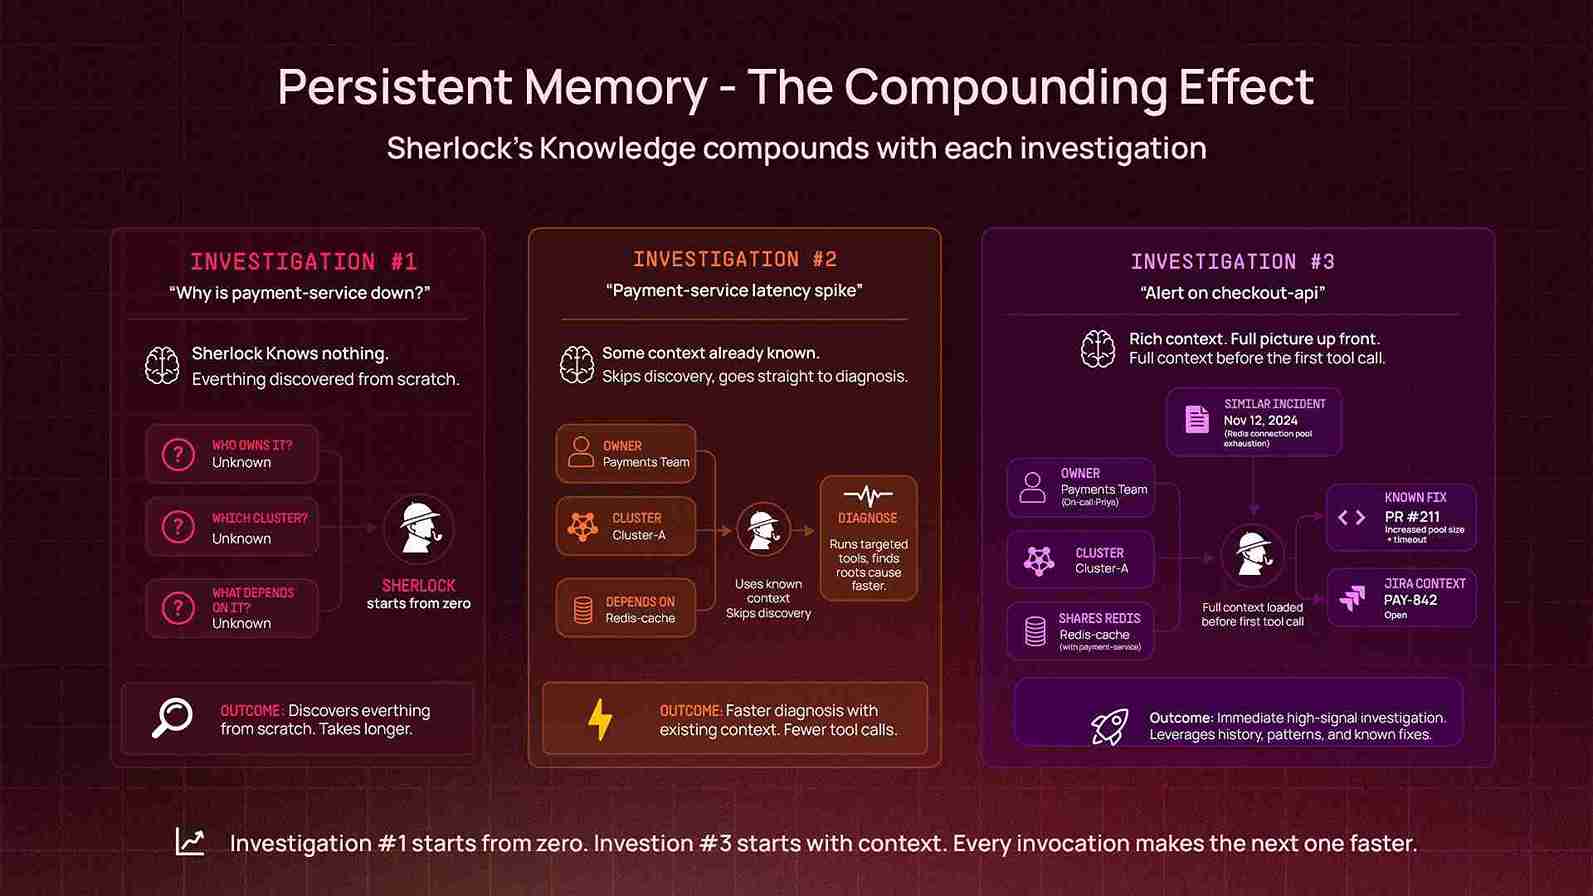
Persistent Memory: The Compounding Effect
An AI agent that forgets everything after each conversation is useful. One that remembers is transformative.
Sherlock uses an adaptive long-term memory system — a persistent knowledge graph that stores and retrieves organizational context across conversations. Unlike traditional retrieval-augmented approaches that search static document stores, Sherlock's memory is learned from experience: every investigation enriches the graph with new relationships, patterns, and context. When an engineer mentions a service name, Sherlock can recall who owns it, what incidents have affected it before, what architecture decisions were made, and what patterns previous investigations revealed. In the first 38 days:
5,201 memory lookups — powering faster, more contextual investigations across every conversation
A continuously growing knowledge graph covering service ownership, incident patterns, architecture decisions, team structures, and operational context
This creates a compounding effect: every investigation makes future investigations better. When Sherlock investigates a message queue lag issue and discovers that a particular consumer group is owned by a specific team and runs on a specific cluster, it remembers that. The next time someone asks about that consumer group, it doesn't start from zero.
The memory layer is especially powerful for organizational knowledge that lives in people's heads but not in any dashboard: which team owns which service, what the expected behavior of a system is, what was tried during the last outage, and what the known quirks of a particular database cluster are.
Architecture Decisions That Mattered
Building Sherlock required several non-obvious architectural choices:
Many AI operations tools work by indexing logs and metrics into a vector database, then doing retrieval over the index. We chose the opposite approach: Sherlock queries live production systems on every investigation. This means it's always working with current data, can follow investigation paths that weren't anticipated at index time, and doesn't require a separate ingestion pipeline to maintain.
The tradeoff is latency — a live Kubernetes API call takes longer than a vector lookup. But for incident investigation, accuracy matters more than speed, and "here's what the system looks like right now" is more valuable than "here's what we indexed an hour ago."
For cloud provider integrations (AWS, GCP), we deploy dedicated MCP (Model Context Protocol) servers as sidecar services alongside
Sherlock. Each MCP server runs in its own pod with its own IAM role, network policy, and resource limits. This provides:
Security isolation: Cloud credentials never enter Sherlock's main process. Each MCP server has the minimum IAM permissions needed for read-only access.
Independent scaling: The AWS MCP server can be scaled independently of the core agent.
Extensibility: Adding a new cloud integration means deploying a new MCP server, not modifying Sherlock's core code.
Every tool in Sherlock's arsenal is read-only by default. Kubernetes tools can inspect but not modify. Database tools can query but not write. AWS and GCP access is scoped to read-only IAM roles. The only write paths are deliberate and scoped: creating Jira tickets, opening GitHub PRs (never committing to main), and posting to Slack threads.
Bash command execution goes through a safety validation layer that blocks dangerous operations. Python code execution runs in a sandboxed environment with timeout limits and output size caps.
Auto-Scaling for Burst Load
Sherlock runs on Kubernetes with horizontal pod autoscaling. During incident spikes — when multiple engineers are investigating the same outage simultaneously — it scales up to 5 replicas within 60 seconds (scale-up stabilization window is set to zero for memory-based scaling). Scale-down is more conservative, with a 2-minute stabilization window to avoid thrashing.
What We Learned
Engineers will use an AI tool if it works in their existing workflow. Sherlock lives in Slack — the same place engineers already discuss incidents, ask questions, and coordinate fixes. There's no separate UI to learn, no dashboard to bookmark. Tag Sherlock in any channel, describe the problem in natural language, and the investigation starts.
Breadth of integrations matters more than depth of any single one. The most valuable investigations are the ones that cross system boundaries: correlating a Kubernetes pod restart with a Prometheus metric spike and a Datadog trace, or connecting a PagerDuty alert to an ArgoCD deployment to a GitHub commit. A tool that only knows Kubernetes, no matter how deeply, can't do this.
The agent should show its work. Sherlock doesn't just deliver conclusions — it shows the data it queried, the metrics it found, the exact commands it would run. Engineers trust it because they can verify the reasoning, not because they're told to trust it.
Memory is the moat. After a month of usage, Sherlock knows things about our infrastructure that no single engineer knows comprehensively. It's the only system that has investigated incidents across every team, every cluster, and every service. That accumulated context makes each subsequent investigation faster and more accurate.
What's Next
Sherlock is reactive today — it investigates when asked. The next evolution is proactive: detecting anomalies before they become incidents, correlating signals across systems that humans wouldn't think to connect, and surfacing issues before anyone pages on-call.
Beyond detection, the trajectory points toward autonomous remediation — not just diagnosing the problem but executing the fix, within carefully scoped safety boundaries. The error quota investigation, where Sherlock went from alert to code fix to PR in a single thread, is a preview of what this looks like.
And with every investigation, the memory layer gets denser, the organizational context gets richer, and the agent gets faster at connecting dots.
We built Sherlock so that every engineer at Pocket FM could debug production like an SRE. Thirty-eight days in, 134 engineers and 3,563 investigations later, the data suggests it's working.
The game is afoot.